CRE underwriting is the analysis of a commercial property’s income, expenses, market and financing to decide what it is worth — and whether a purchase or a loan makes sense at a given price. It turns a broker’s documents into a net operating income you can defend line by line, then tests value, debt and returns against it.
This guide covers the whole discipline: who underwrites and why, the documents, the six stages of the process, the metrics and their formulas, how property types differ, and the mistakes that cost the most. Instead of a template with tidy numbers, it follows one real deal throughout — a 272-unit apartment property offered for sale in late 2025, whose full walkthrough is in our guide on how to underwrite a multifamily property. Every dollar figure from that deal is as its documents state it, or computed from them.
What is CRE underwriting?
Underwriting is the step between “here is a deal” and “here is what we will pay, or lend”. The underwriter takes what the seller and broker provide — an offering memorandum, operating statements, a rent roll — and answers three questions:
- What does the property actually earn today? Not what the marketing says: what the leases, the ledger and the tax bill support.
- What is that income worth? Usually by capitalizing it at a market cap rate, and by projecting it across a holding period.
- What can the deal carry? How much debt the income supports, and what is left for the equity.
The answers are only as good as the first one. Every later number — value, loan size, IRR — is arithmetic on the net operating income, so most of the skill in commercial real estate underwriting is in getting the NOI right.
Who underwrites a commercial property — and how do lenders and investors differ?
The same deal is underwritten several times, by people with different questions:
| Lender | Equity investor | |
|---|---|---|
| Core question | Will the property repay the loan, with a cushion? | What will this earn, and is the price right? |
| Focus | Downside: in-place income, stress cases | Downside and upside: the business plan |
| Key metrics | DSCR, loan-to-value, debt yield | Cash-on-cash, IRR, equity multiple |
| Sponsor review | Borrower’s net worth, liquidity, track record | The operating partner’s ability to execute |
| Typical stance on a pro forma | Sizes on trailing income; pro forma is upside | Pays for some of it — the question is how much |
Appraisers, asset managers and credit committees underwrite too, but the split that matters is this one: a lender underwrites the income that exists; an investor also underwrites the income they plan to create. A deal works when both views hold at the same price.
What documents do you need to underwrite a commercial property?
- Offering memorandum (OM) — the broker’s marketing document: property facts, rent comparables, a historical column and a pro forma.
- Trailing-12 operating statement (T12) — income and expenses by month for the last twelve months, from the property manager’s books.
- Rent roll — one row per unit or suite: who is in it, what they pay, when the lease ends.
- Leases or lease abstracts — essential for office, retail and industrial, where a single lease can carry rent steps, expense recoveries, options and termination rights.
- Tax bill, insurance, capital expenditure history — the expense lines a new owner will re-price.
- Third-party reports in due diligence — appraisal, property condition assessment, Phase I environmental site assessment, survey and title.
The documents overlap, and they disagree. On our worked deal the package held a 24-page OM, two rent rolls, and three operating statements from two different management companies — and the “T12” files turned out to contain eight, ten and eleven months of data respectively. Deciding which version of each number to believe is the first real work of underwriting.
What are the steps of the commercial real estate underwriting process?
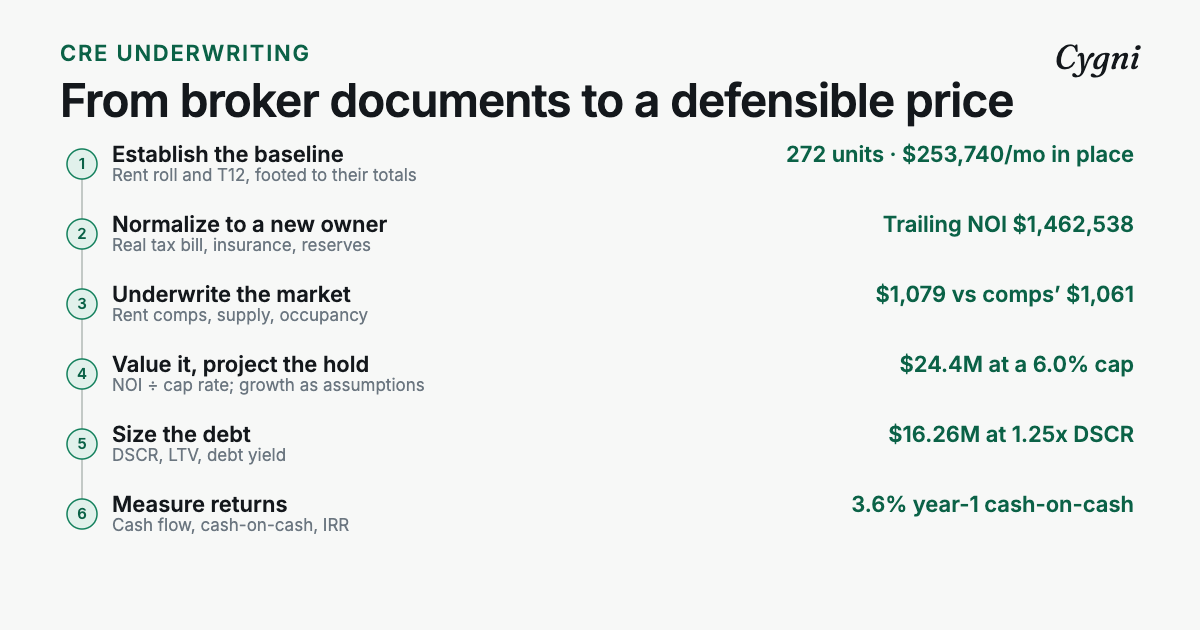
1. Establish the baseline
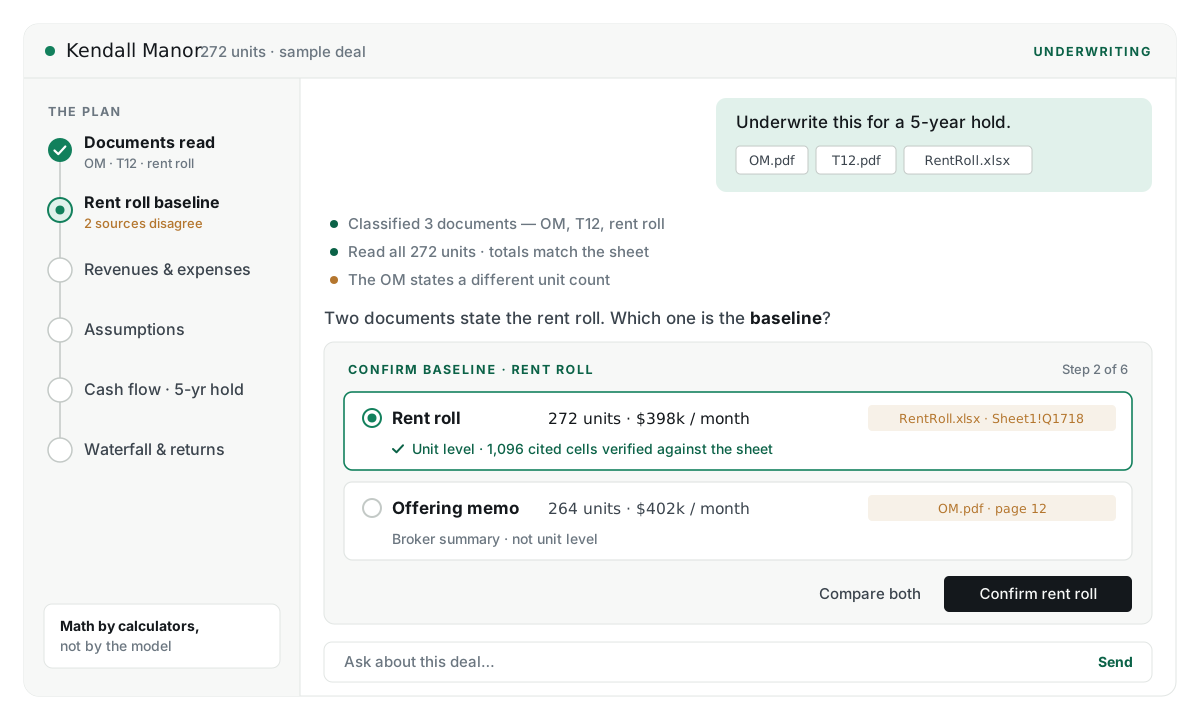
Start from the rent roll and the T12, and make each one foot: add up the rows and check them against the totals the document prints. On the worked deal, the rent roll’s 272 units, $293,370 of monthly market rent and $253,740 of lease rent all reconcile to its own summary. An early automated parse of the same roll had counted 288 units — a block of charge codes at the bottom had been read as units — and only the footing check caught it.
Then read the statuses, not the occupancy line. The roll’s summary said 86% occupied; 23 of those households were on notice or in eviction, so the property was 77.6% leased and staying. A buyer inherits the second number.
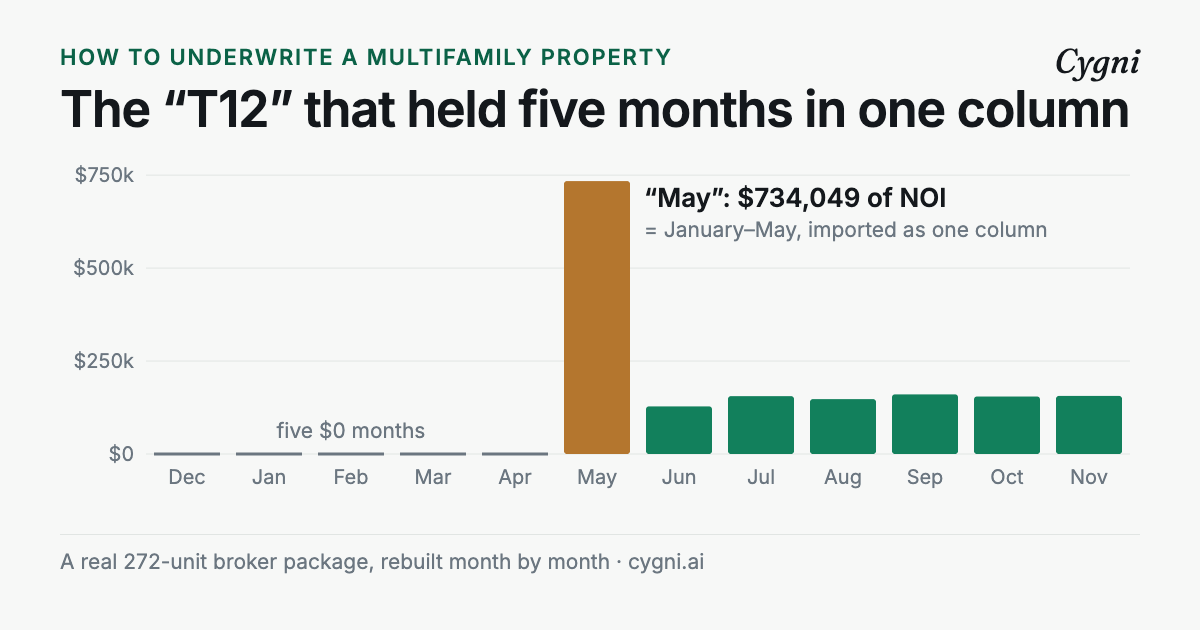
For the trailing income, rebuild the year month by month if management changed. This deal’s newest T12 showed five months at $0 and a “May” column holding January to May as one lump, so its bottom line was a ten- or eleven-month total presented as twelve.
2. Normalize to a new owner
A T12 records what the current owner paid. Underwrite what you will pay:
- Real estate taxes at the actual bill — the deal’s ledgers accrued $200,464 over the year against a real bill of $439,520 — and consider whether a sale will reset the assessment toward your price.
- Insurance at a quote for your program, not the seller’s.
- Management fee at a market rate, even if the owner self-manages.
- Replacement reserves, typically expressed per unit or per square foot ($250 a unit on this deal).
Normalized this way, the worked deal’s trailing NOI is $1,462,538 — within $2,690 of the broker’s own trailing column. The two agreeing is what tells you the history is credible.
3. Underwrite the market
The property’s rents and occupancy only mean something next to its competition. The OM’s own comparable set shows why the unit of comparison matters: the subject’s average market rent, $1,079 a month, is above the comps’ weighted average of $1,061 — but its units average 980 square feet against the comps’ 872, so per square foot it rents at $1.10 against $1.20, about 8% below. Its 86% occupancy also trails the comps’ 91%. Whether that is upside or a warning is the market question. Check new supply in the submarket, employment drivers, and whether rent growth assumptions match what comparable properties have actually achieved.
4. Value it, and project the hold
The simplest valuation is direct capitalization: value = NOI ÷ cap rate. At an illustrative 6.0% cap rate, the deal’s normalized NOI of $1,462,538 implies about $24.4 million, or $89,616 a unit.
A projection then carries the NOI forward across the holding period — rent growth, vacancy, renovation premiums, expense growth — to an exit valued at an exit cap rate. Keep two things separate here. A trailing figure is a fact; every number in a projection is an assumption, and each one should be visible and individually defensible. The broker’s pro forma on this deal put Year 1 NOI at $1,879,253, 28% above trailing; capitalized at the same 6.0%, that is $6.9 million more value, built from five separate bets (other income, market rent growth, a renovation premium, lower vacancy and cheaper insurance). Our multifamily walkthrough bridges that gap line by line.
5. Size the debt
Lenders size loans to coverage and leverage limits. Fannie Mae’s conventional multifamily term sheet, for example, sets a minimum DSCR of 1.25x at up to 80% loan-to-value. With an illustrative 6.0% rate on 30-year amortization, the deal’s trailing NOI supports a loan of about $16.26 million at exactly 1.25x — annual debt service of $1,170,030.
6. Measure returns
What is left after debt service belongs to the equity. On the numbers above — a $24.4 million price and a $16.26 million loan — the equity is about $8.11 million and Year 1 cash flow after debt service is $292,508: a 3.6% cash-on-cash return before any growth. That is the in-place return; the business plan has to justify everything above it. Over a full hold, investors measure IRR (the discount rate at which all equity cash flows net to zero) and the equity multiple (total distributions ÷ equity invested), and a waterfall decides how those distributions are split between the sponsor and the investors.
What metrics matter in CRE underwriting?
Every metric below is arithmetic on the NOI. The right-hand column applies it to the worked deal at the illustrative inputs above (6.0% cap rate; 6.0%, 30-year loan sized to 1.25x; closing costs ignored).
| Metric | Formula | On the worked deal |
|---|---|---|
| Net operating income (NOI) | Effective gross income − operating expenses | $1,462,538 (normalized trailing) |
| Cap rate | NOI ÷ value | 6.0% → $24.4M value |
| Price per unit | Value ÷ units | $89,616 |
| Debt service coverage (DSCR) | NOI ÷ annual debt service | 1.25x ($1,170,030 debt service) |
| Loan-to-value (LTV) | Loan ÷ value | 66.7% |
| Debt yield | NOI ÷ loan amount | 9.0% |
| Cash-on-cash return | Year-1 cash flow after debt service ÷ equity | 3.6% |
| Expense ratio | Operating expenses ÷ effective gross income | 58.4% trailing; 52.6% in the broker’s Year 1 |
| IRR | Discount rate at which equity cash flows net to zero | Depends on the projection |
| Equity multiple | Total distributions ÷ equity invested | Depends on the projection |
Two things the table makes visible. First, the lending metrics and the equity return are linked: at a 1.25x DSCR, debt service takes 80% of NOI, which is why the in-place cash-on-cash is thin. Second, debt yield ignores the interest rate — NOI over loan amount, 9.0% here — which is why lenders use it as a check that does not move when rates do.
How does underwriting differ by property type?
The six stages are the same everywhere. What changes is where the income risk sits.
- Multifamily. Hundreds of short leases, so income is statistical: occupancy, turnover, loss-to-lease, concessions and other income. Leases reprice quickly, in both directions. See the multifamily walkthrough for every step on a real property.
- Office. A few large, long leases, so income is contractual and lumpy. Underwrite lease by lease: expirations and renewal probability, downtime between tenants, tenant improvement and leasing commission costs to re-let, and the credit of the largest tenants. Weighted average lease term (WALT) summarizes the exposure.
- Retail. Similar lease-by-lease work, plus expense recoveries (CAM, taxes and insurance passed through to tenants), anchor tenants and the co-tenancy clauses that can let smaller tenants cut rent or leave if an anchor goes, and sometimes percentage rent tied to sales.
- Industrial. Often single-tenant or few-tenant on net leases, where the tenant pays most expenses. The underwriting weight shifts to the tenant’s credit, the remaining term, how re-lettable the building is, and rent against market at expiration.
- Hotels and other operating businesses (and, to a degree, self-storage and senior housing) are underwritten more like businesses: revenue per available unit, operating margins and the operator.
How do you stress-test an underwriting?
A single NOI and a single cap rate give you a single answer, which is the least useful thing an underwriting can produce. Test the inputs that move the result most:
- Cap rate. On the worked deal’s normalized NOI, each half-point of cap rate moves value by roughly $1.6 to $2.7 million across the 5.0%–7.0% range.
- Interest rate. Hold the $16.26 million loan and raise the rate from 6.0% to 7.0%: annual debt service rises to $1,298,346 and DSCR falls from 1.25x to 1.13x — below the minimum the loan was sized to.
- NOI. At 1.25x, NOI can fall 20% before debt service is no longer covered at all.
- The pro forma’s bets, one at a time. Turn off each assumption that separates Year 1 from trailing and see which ones the price depends on.
What are the most common CRE underwriting mistakes?
Most expensive mistakes are reading mistakes, not math mistakes. From the worked deal alone:
- Taking a “T12” total at face value when the file holds fewer than twelve months, or lumps several into one column.
- Using the occupancy line instead of the statuses beneath it — 86% versus 77.6% leased and staying.
- Underwriting the tax accrual rather than the bill, and forgetting a sale may reset the assessment.
- Annualizing one month of a growing income line as a full year.
- Accepting the seller’s insurance — or the pro forma’s cut to it — without a quote.
- Pricing on the pro forma. Paying Year 1 value on day one hands the seller the upside the buyer still has to create.
- Not footing the documents. A rent roll that does not reconcile to its own totals is a parse error or a data problem; either way, nothing built on it is safe.
Where does software fit in CRE underwriting?
Underwriting has two halves with different failure modes. Reading — extracting hundreds of figures from PDFs and spreadsheets, reconciling them, and noticing what does not add up — is slow and error-prone by hand, and it is where the mistakes above happen. Calculating — NOI, debt service, IRR, waterfalls — should be done by deterministic code that gives the same answer every time.
That split is how Cygni’s commercial real estate underwriting platform is built: it reads the OM, T12 and rent roll with a citation behind every figure, foots each table against the totals it prints, puts conflicting sources in front of the underwriter to choose between, and leaves the arithmetic to calculators. For where AI helps in that process and where it should not, see how AI is used in commercial real estate underwriting.
Frequently asked questions
What is CRE underwriting?
CRE underwriting is the analysis of a commercial property's income, expenses, market and financing to decide what it is worth and whether a purchase or a loan makes sense at a given price. Its core output is a net operating income you can defend line by line, against which value, debt capacity and investor returns are tested.
What is the difference between lender and investor underwriting?
Both start from the same documents and the same net operating income. A lender underwrites the downside — will the property cover its debt payments and leave a cushion, measured by DSCR, loan-to-value and debt yield. An equity investor underwrites the upside as well — what the property will earn over the hold and on sale, measured by cash-on-cash return, IRR and equity multiple.
What are the key metrics in commercial real estate underwriting?
Net operating income (NOI); the cap rate, which links NOI to value; debt service coverage ratio (DSCR), loan-to-value (LTV) and debt yield on the lending side; and cash-on-cash return, internal rate of return (IRR) and equity multiple on the equity side. Every one of them is arithmetic on the NOI, which is why the NOI is where underwriting effort belongs.
What documents are needed to underwrite a commercial property?
The offering memorandum, a trailing-12 operating statement (T12), and a rent roll — plus, for office, retail and industrial, the leases themselves or lease abstracts. Add the current tax bill, insurance information and capital expenditure history; due diligence adds third-party reports such as an appraisal, a property condition assessment and a Phase I environmental site assessment.