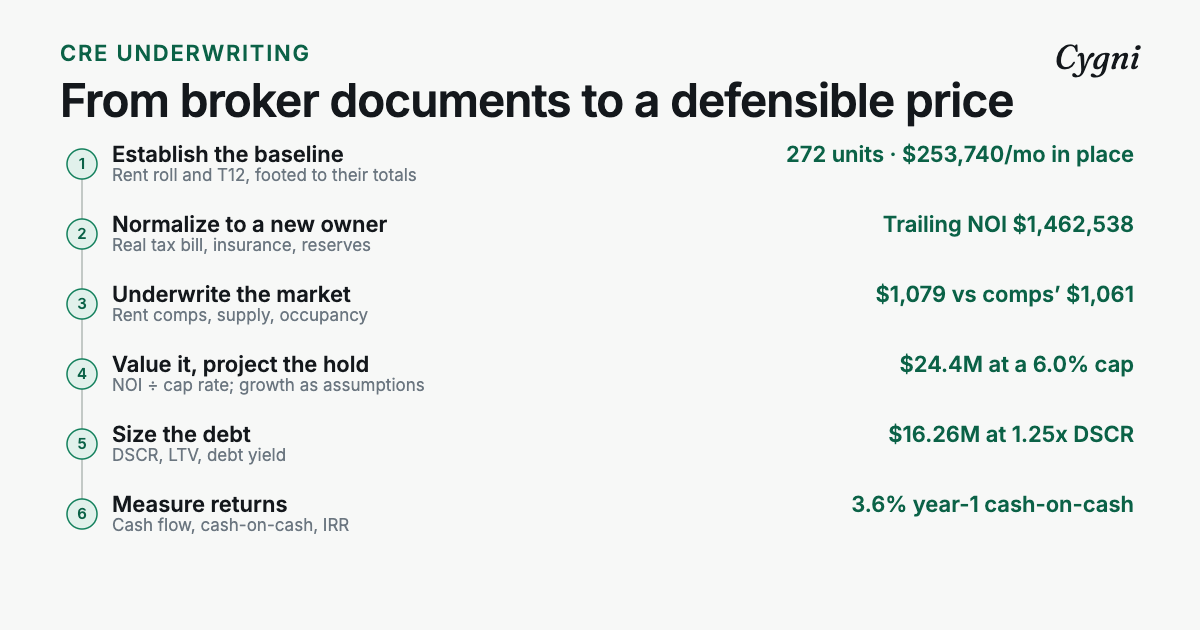
To underwrite a multifamily property, you rebuild its current income from the rent roll and the T12, restate expenses as a new owner will pay them, arrive at a net operating income (NOI) you can defend line by line, and only then test price, debt and returns against it. Below is every step on one real 272-unit deal — including the places its documents disagreed with each other.
Most guides to multifamily underwriting walk through a template with tidy numbers. Real broker packages are not tidy. This one is a 272-unit, 1981-vintage garden-style apartment community offered for sale in late 2025: a 24-page offering memorandum (OM), two rent rolls, and three operating statements from two different management companies. We have withheld the property’s name, location and the firms involved. Every dollar figure below is as those documents state it, or computed from them. This is the multifamily chapter of our complete guide to CRE underwriting.
Key takeaways
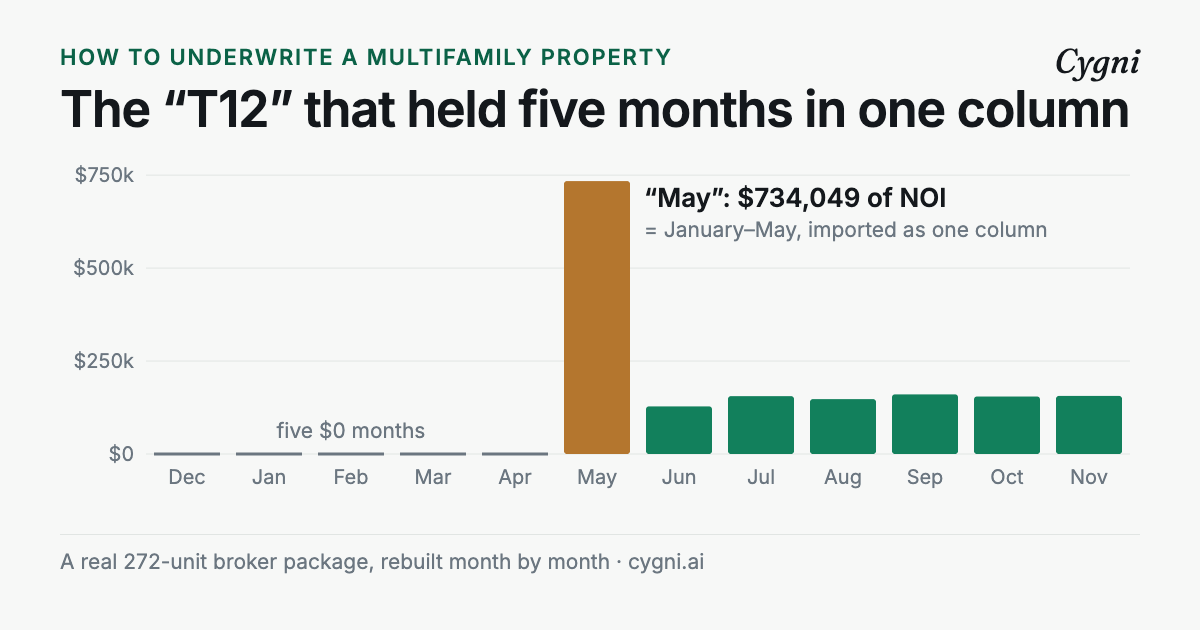
- The seller's trailing statements were not twelve months: five months of NOI arrived as a single $734,049 "May" column. Rebuild the T12 month by month.
- The books accrued $200,464 of property tax over the year; the actual tax bill is $439,520. Underwrite the bill.
- "86% occupied" was 77.6% leased and staying, once residents on notice or in eviction are counted.
- Normalized, trailing NOI is $1,462,538, within $2,690 of the broker's own trailing column. The broker's Year 1 is $1,879,253, 28% higher.
- At a 6.0% cap rate, the gap between those two NOIs is worth $6.9 million.
What’s in a multifamily broker package?
A typical package, and this one, contains:
- The offering memorandum — the broker’s marketing document: property facts, rent comparables, a “historical” column, and a pro forma Year 1 with a ten-year cash flow.
- The rent roll — one row per unit: type, square footage, status, market rent, the lease rent actually charged, and every other monthly charge. This one runs to 1,749 rows.
- The T12 — the trailing twelve months of income and expenses, by month, from the property manager’s accounting system.
The point that matters before any arithmetic: the package states the same facts several times, and the statements will not agree. The OM restates the rent roll. The rent roll prints its own summary. Two managers each exported a “trailing” statement. Underwriting is deciding which version of each number you believe, and being able to say why.
Step 1: How many units are there — and who is actually paying?
Multifamily underwriting starts with the rent roll, and with making it foot: add up your rows and check them against the totals the document prints. This roll prints 272 units, $293,370 of monthly market rent and 266,468 square feet. Parsed unit by unit, our rows match all three, and the $253,740 of lease rent matches the “Rent” line in the roll’s own charge summary.
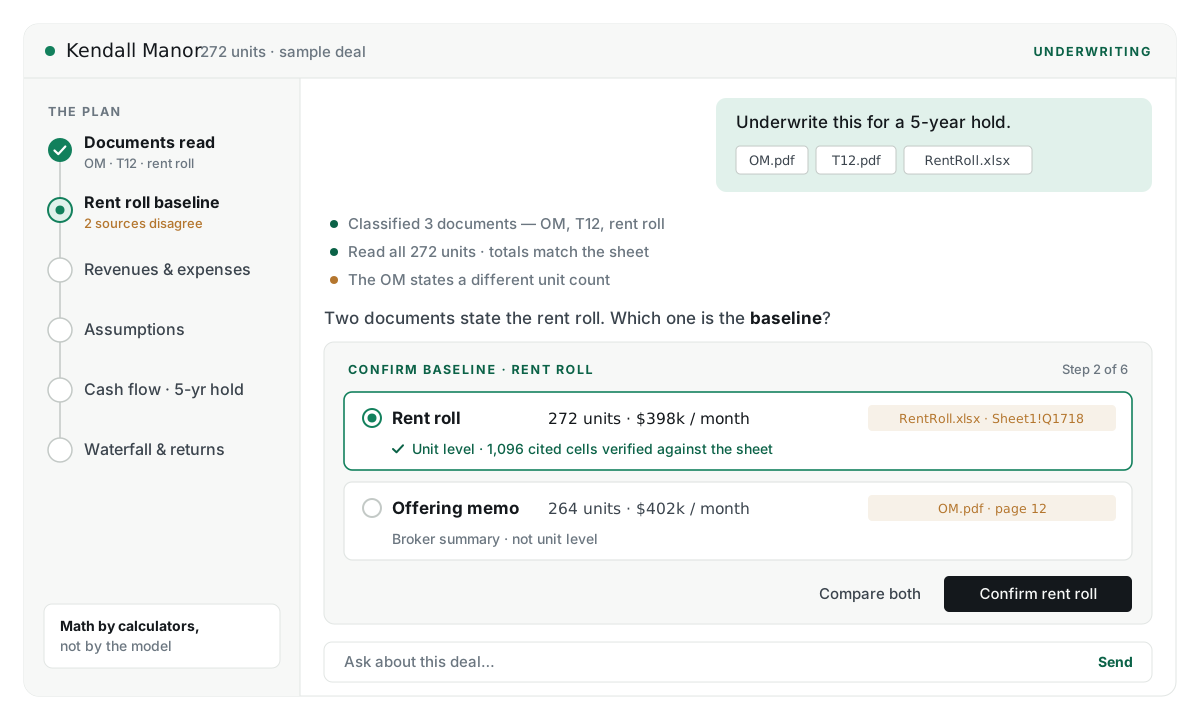
That check is not a formality. When we built Cygni’s rent-roll extraction, an early parse of this property’s rent roll counted 288 units: the charge-code summary at the bottom of the roll (“Bldg. and Facilities Fee”, “Valet Trash Service” and so on) has the same shape as a unit row, and it was swept into the unit list. A unit count of 288 looks perfectly plausible. It only failed because the parse was footed against the 272 the sheet prints. Nobody would have caught it by eye.
Once the count is right, read the status column rather than the occupancy line:
The summary says 86% occupied — 234 units. But 10 of those residents have given notice to vacate, and 13 more are flagged “UE” in the property-management system: every one of them carries a scheduled move-out date, and 12 of the 13 owe a combined $34,723. That is the profile of units in eviction. The number of households that are leased, paying and staying is 211 — 77.6%. That, not 86%, is the occupancy a buyer inherits.
Then look at when the leases end:
Seventy-nine leases — 29% of the building — expire in February, March and April 2026. That is a leasing risk and an opportunity at the same time: if market rents hold, that is where a rent increase gets captured; if they don’t, that is where vacancy climbs.
Step 2: Are in-place rents above or below market?
The next question is loss-to-lease: are residents paying less than the property’s own market rents? If they are, there is upside simply in renewing leases at market. Compare by unit type, using occupied units only. The codes are the property’s own: A types are one-bedrooms (658–750 SF), B types two-bedrooms (985–1,158 SF), TH a townhome; an R variant of a plan is listed at a higher market rent than the base plan.
| Type | Units | Occ. | Market | In-place |
|---|---|---|---|---|
| A1 | 26 | 23 | $795 | $810 |
| A1R | 2 | 2 | $950 | $950 |
| A2 Downstairs | 16 | 14 | $940 | $941 |
| A2 Upstairs | 16 | 15 | $915 | $930 |
| B1 | 119 | 100 | $1,080 | $1,089 |
| B1R | 5 | 4 | $1,200 | $1,191 |
| B2 TH | 80 | 69 | $1,195 | $1,201 |
| B2R TH | 8 | 7 | $1,375 | $1,366 |
| Total | 272 | 234 | $293,370 | $253,740 |
Rows are average monthly rent per unit. The total row is the monthly sum: market rent across all 272 units, in-place rent across the 234 occupied ones.
The 234 occupied units have market rents totalling $251,950 a month and are charged $253,740 — 0.7% above market, not below it. There is no loss-to-lease to burn off. Concessions are still being given: the November roll carries $7,112.50 of move-in specials and renewal credits.
That changes the question you put to the pro forma. If rents are already at market, every dollar of rent growth in Year 1 has to come from the market rising or from renovated units commanding a premium — not from catching up existing leases.
Step 3: Is the T12 really twelve months?
This is where this deal’s documents stopped agreeing with themselves.
The property changed management in 2025. The previous manager’s file is named as a June 2025 T12 and its header claims June 2024 to May 2025 — it holds eight monthly columns, November 2024 to June 2025. The new manager’s trailing statement through November 2025 looks like a standard twelve-column T12 until you read the columns:
The new manager’s system shows $0 for five months, December through April, and then a “May” column of $734,049 of NOI. That is not one month. It is January through May imported as a single lump: the previous manager’s January–May NOI sums to $734,048.90, matching the lump to the cent. With December empty, this “trailing twelve” holds eleven months of operations — and the same manager’s export through October, also in the package, holds ten.
So any total read off the bottom of that file is wrong by construction. The fix is to rebuild the trailing twelve months yourself, month by month, from whichever ledger was the system of record for each month: December 2024 to May 2025 from the previous manager, June to November 2025 from the new one.
One wrinkle you should expect on any takeover: both ledgers contain June 2025, and they disagree — $156,525 of NOI in the old books, $128,011 in the new. We used the new manager’s figure, because from June it owned the books, but a gap like that is a question for the seller, not something to average away.
Step 4: What will the expenses be under new ownership?
A T12 records what the current owner paid. You are underwriting what you will pay. Three lines on this deal show why the difference matters.
Real estate taxes. Across the rebuilt twelve months the ledgers book $200,464 of property tax — including a January reversal of −$62,046 and a flat $20,300-a-month accrual from May onward. The property’s actual 2025 tax bill, from the assessment and rate printed in the OM, is $439,520. Underwrite the bill, not the accrual.
Replacement reserves. The OM adds $250 per unit per year — $68,000 — to its historical columns “for comparative purposes”. Do the same, so your trailing NOI and the broker’s are on the same footing.
Insurance. The trailing twelve months in the OM show $331,808. The pro forma assumes $244,800 — $900 a unit, a 26% cut. Maybe a new owner’s program is cheaper; that is a quote you get, not a number you accept.
The 50% rule. A common shortcut assumes operating expenses run about half of gross income. Check it against the documents instead of assuming it. In the OM’s trailing twelve, expenses including reserves were $2,061,001 on $3,526,229 of effective gross income — 58.4%. The pro forma’s Year 1 runs at 52.6%. Both sit above the rule of thumb, and the six-point drop from history to Year 1 is itself an assumption to test.
Make those adjustments and see how many “trailing NOI” figures this one property has:
| Trailing NOI figure | Amount | What it is |
|---|---|---|
| New manager’s “T12” through Oct 2025 | $1,480,182 | Ten months of operations in a twelve-month frame |
| New manager’s trailing P&L through Nov 2025 | $1,636,418 | Eleven months |
| Rebuilt Dec 2024–Nov 2025, taxes as booked | $1,769,594 | Twelve real months; tax is an accrual |
| Rebuilt, real tax bill and reserves | $1,462,538 | Twelve months, normalized |
| Broker’s trailing-12 column | $1,465,228 | The OM’s history, reserves included |
| Broker’s pro forma Year 1 | $1,879,253 | A projection, not a trailing figure |
Six numbers for one property’s trailing NOI, from $1.46 million to $1.88 million. Two of them agree: our month-by-month rebuild, with the real tax bill and reserves, comes to $1,462,538; the broker’s own trailing-12 column says $1,465,228 — within $2,690. That agreement is the useful result. It means the broker’s history is credible, and it isolates the real question to one place: the jump from history to the pro forma.
There is one more tax question the T12 cannot answer. In many jurisdictions a sale moves the assessment toward the price paid. If this property sold for the $31.3 million that the broker’s Year 1 NOI implies at a 6.0% cap rate, and was assessed at that price at the current rate, taxes would be $719,443 — $266,737 more than the pro forma’s $452,706, and Year 1 NOI would fall to about $1.61 million. Whether and how fast that happens depends on the jurisdiction. Underwrite it as an explicit question, not an omission.
Step 5: What does the broker’s pro forma assume?
The OM’s pro forma Year 1 NOI is $1,879,253, 28% above its own trailing twelve. Because both columns sit on the same page, you can bridge one to the other line by line:
Read the bridge against what Steps 1–4 found:
- Other income, +$184,925 is the largest single step. The pro forma carries forward the most recent month, annualized, rather than the trailing year: smart-tech income was $53,224 over the trailing twelve and $128,448 annualized from the latest month; utility reimbursements $255,872 against $326,135. Fees that were introduced recently can be real — but one month is a thin basis for a full year.
- Market rent growth, +$152,584, and the renovation premium, +$136,787 — one-third of a $410,362 annual premium program the OM schedules over three years — have to carry all of the rent upside, because Step 2 found no loss-to-lease.
- Vacancy, bad debt and concessions, +$57,670 assumes economic loss improves. The pro forma underwrites 10% vacancy; today 38 of 272 units are vacant (14%) and another 23 occupied units are on notice or in eviction.
- Insurance, +$87,008 is the $900-a-unit assumption from Step 4.
None of these is wrong on its face. A value-add buyer may well achieve them. The discipline is to see each one as a separate bet, with its own evidence, instead of one Year 1 number.
Step 6: What is the property worth?
The simplest valuation is direct capitalization: value equals NOI divided by a cap rate. We are not going to assert a market cap rate for this asset; the table shows what the choice of NOI does across a range:
| Cap rate | Value on trailing NOI | Value on Year 1 NOI | Gap |
|---|---|---|---|
| 5.0% | $29.25M · $107.5k/unit | $37.59M · $138.2k/unit | $8.33M |
| 5.5% | $26.59M · $97.8k/unit | $34.17M · $125.6k/unit | $7.58M |
| 6.0% | $24.38M · $89.6k/unit | $31.32M · $115.2k/unit | $6.95M |
| 6.5% | $22.50M · $82.7k/unit | $28.91M · $106.3k/unit | $6.41M |
| 7.0% | $20.89M · $76.8k/unit | $26.85M · $98.7k/unit | $5.95M |
Trailing NOI is the rebuilt, normalized $1,462,538; Year 1 is the broker’s $1,879,253.
At a 6.0% cap rate, valuing the building on the broker’s Year 1 instead of the normalized trailing NOI adds $6.9 million — $25,534 a unit — before the tax reassessment in Step 4 takes any of it back. That gap is the price of believing the pro forma on day one. If the bets in Step 5 come in, a buyer who paid trailing value captures them; a buyer who paid pro forma value has already handed them to the seller.
Step 7: How much debt will it support?
Lenders size multifamily loans on debt service coverage: NOI divided by annual debt service. Fannie Mae’s conventional multifamily term sheet sets a minimum of 1.25x at up to 80% loan-to-value.
Take an illustrative 6.0% rate on 30-year amortization. Annual debt service is 7.19% of the loan, so at 1.25x the maximum loan is NOI ÷ 1.25 ÷ 0.0719:
- On the normalized trailing NOI of $1,462,538: about $16.26 million.
- On the broker’s Year 1 NOI of $1,879,253: about $20.90 million.
A lender will usually size on trailing or in-place income, not your Year 1. If your price was built on the pro forma, the shortfall between those two loans is equity you have to bring.
Step 8: What should the underwriting conclude?
The output of underwriting is not a single NOI. It is a set of decisions, each with a source:
- Unit count and occupancy — 272 units, footed to the roll's printed totals; 211 leased and staying, not 234.
- Rent baseline — in-place rents at market; no loss-to-lease to capture.
- Trailing NOI — rebuilt month by month across both ledgers; taxes at the real bill; reserves included.
- Each pro forma bet — other income, rent growth, renovation premium, vacancy, insurance — accepted, haircut, or rejected, one at a time.
- Taxes after sale — modelled at the price you intend to pay.
- Value and debt — on the NOI a lender will size on, with the pro forma as upside rather than as price.
The hard part of this multifamily deal was never the arithmetic. It was noticing that an eight-column file was called a T12, that one column held five months, that a tax line was an accrual and not a bill, and that “86% occupied” included 23 households on their way out. Those are reading problems. They are also exactly where a model built from a single document goes wrong.
That is the job we built Cygni to do: read the OM, T12 and rent roll, cite where every figure came from, foot each table against the totals it prints, and put conflicting sources in front of you to choose between — before any pro forma analysis is built on them. For where AI helps in that process and where it shouldn’t, see how AI is used in commercial real estate underwriting.
Frequently asked questions
What documents do you need to underwrite a multifamily property?
At minimum: a current rent roll, a trailing-12 (T12) operating statement, and the broker's offering memorandum. Add the current property tax bill, the insurance declarations or a quote, and — if management has changed — the previous manager's statements, because a takeover is where monthly history gets lumped or lost.
How do you calculate NOI for a multifamily property?
Net operating income is effective gross income (rent actually collected plus other income, after vacancy, bad debt and concessions) minus operating expenses. It excludes debt service and capital spending. Many underwriters also deduct replacement reserves — a per-unit annual allowance, $250 on the deal worked here — so NOI reflects what a new owner will really keep.
What is a good DSCR for a multifamily loan?
Fannie Mae's conventional multifamily term sheet sets a minimum debt service coverage ratio of 1.25x at up to 80% loan-to-value. DSCR is NOI divided by annual debt service, so a 1.25x minimum means NOI must exceed the mortgage payments by 25%. Which NOI the lender sizes on — trailing or projected — decides how much it will lend.
What is the 50% rule in multifamily underwriting?
A rule of thumb that operating expenses, before debt service, run about half of a property's gross income. It is a quick screen for a broker's numbers, not an underwriting: on the 272-unit deal worked here, trailing expenses including reserves were 58.4% of effective gross income, and the broker's Year 1 projected 52.6%.
How do you value a multifamily property?
The usual starting point is direct capitalization: value equals NOI divided by a market cap rate. The hard part is the NOI, not the division. On the deal worked here, capitalizing the broker's Year 1 NOI instead of the normalized trailing NOI adds $6.9 million of value at a 6.0% cap rate.